We had an interesting conversation with a friend recently. He had spent long hours (if not days) researching the tuning potential of “unlocked” processors. I doubted it’s worth the effort. He then grabbed a pencil: by running his simulations and algorithms 2–3 hours a day on average—that’s hundreds of hours a year—the 10% boost he gains will spare him 50–100 hours a year. Correct, actually…
My next question was whether he spent some time optimizing the data layout as well. The answer was surprising. In response, I got some O(n*m) formulas and abstract run time estimations, potentially filling an entire textbook, but nothing on the actual arrangement of data related to the question. I realized that even seasoned experts are not always fully aware of the importance of in-memory data structure. Especially strange is how we can overlook its huge impact while giving so much respect to other constant factors like a few percent extra CPU speed.
Data access and speed gain
It’s long been known that the cache and prefetcher make a serious difference on performance. Many applications and libraries are permanently improved along this principle, from Unity to all the math collections; still, these appear as dark corners of computer science in many of our eyes. Actually, I didn’t devote enough attention to them either until being lucky enough to sit in the audience at the Build 2014 conference in Herb Sutter presentation. If you haven’t seen it yet, I strongly recommend devoting the time. (There are actually two things to learn from this presentation. The second is this prefetcher thing… The first is how to give such talks on “dry” technical topics.)
Long story short, organizing and accessing your data along proper patterns makes your code run faster. Let’s find out how much faster.
- Note, these synthetic examples emphasize the data access parts of codes. In these benchmark scripts, 100 percent of the measured code benefits from structured memory access. (That’s what these scripts are built for.) In real applications, only some fraction of the entire program will experience the speed-up and the overall gain depends on their fraction in the application’s overall execution time. This is analogous to Amdahl’s law on how partially amortized execution time influences the end result (https://en.wikipedia.org/wiki/Amdahl%27s_law).
- Disclaimer: For precise measurements, in general, I recommend using a dedicated library (like BenchmarkDotNet). Some of these measurements were also double-checked that way too. The scripts presented in the post are measuring run time directly to keep the code self-contained. The stopwatch approach is perfectly acceptable here because the differences we demonstrate are far bigger than the possible imprecision caused by, e.g., an improperly avoided CPU throttling effect. (See more comments on measurement hints at the end of the post.)
Experiments – C++ and C#
Results
Bottom line up front: Compared with the optimal access pattern, the worst case took longer by some two orders of magnitude in both languages.
The measured times are remarkably similar for each step size between languages. (The C# baseline case (step size = 1) had a bit longer run time than its C++ counterpart. That makes the ratio against the worst cases a bit different. Otherwise, the results go hand in hand.) The ratio was 116 for the C++ code and 73 for C#.
The cases with step size = 0 are given for reference as they represent the case where we always read a single location, i.e., the value is guaranteed to come from cache after the first access. As we see, the cases with step size = 1 take barely longer. The prefetcher probably knows its job.
The measurements start steeply increasing soon, however. By the time we reach the step size of 25, the execution times are already 10x times longer (or 3–4x for step size of 10). This is not even an unrealistic case, we do it every day: just enumerate one selected field from an array of bigger structs.
The situation gets worse when moving to even bigger steps as we bring in further multipliers. Although it’s less likely that you have such massive structs in an array, allocations from a fragmented heap in long running server applications or write-intensive use cases of chained lists can easily make us access unrelated distant regions in a simple traversal.
The test codes are a bit simplified for brevity. Repeated runs used to avoid CPU throttling, boost, and other effects (see Appendix) are not presented here. Usually, I also measure the loops themselves separately while doing other “register only” tasks, etc.
The allocated buffers are initialized although we don’t care about the accessed values themselves; however, this puts some basic load on the processor and seems to “stabilize” clock frequency by the time the measurements start. Note that tests are always compiled to “Release” target, so you need to “do something” with the values read from memory, otherwise the compiler may “optimize out” the entire workload. To avoid this, we add them up and print the final result, even if the exact value is irrelevant. (Actually, you could use the sum to check that no mistake was made because the loop is really executed the same number of times as the elements are all initialized to 1.)

#include <iostream>
#include <bitset>
#include <math.h>
#include <chrono>
using namespace std::chrono;
using namespace std;

int main()
{
    unsigned long numsteps = 500 * 1000 * 1000;
    unsigned long stepSizes[] = { 0, 1, 2, 3, 4, 5, 10, 25, 50, 100, 250, 500, 1000, 2500, 5000, 10000, 25000, 50000, 100000, 250000, 500000};

    unsigned long bits = 30;
    unsigned long bufferSize = (unsigned long)pow(2, bits);
    unsigned long mask = bufferSize - 1;

    int* V = new int[bufferSize];
    for (unsigned long i = 0; i < bufferSize; ++i)
        V[i] = 1;

    long S = 0;
    for(unsigned long step : stepSizes)
    {
        auto t0 = std::chrono::high_resolution_clock::now();

        for (unsigned long i = 0L; i < numsteps; ++i)
        {
            auto idx = (i * step) & mask;
            S += V[idx];
        }

        auto t1 = std::chrono::high_resolution_clock::now();
        auto dt = duration_cast<std::chrono::microseconds>(t1 - t0).count();
        cout << step << ": " << dt / 1e6 << "\n";
    }

    cout << "\n\n" << S;
    delete[] V;
}
The C++ test code
using System;
using System.Diagnostics;
using System.Threading;

namespace ConsoleApp1
{
    class Program
    {
        static void Main(string[] args)
        {
            long numsteps = 500 * 1000 * 1000;
            int[] stepSizes = new int[] { 0, 1, 2, 3, 4, 5, 10, 25, 50, 100, 250, 500, 1000, 2500, 5000,
                                          10000, 25000, 50000, 100000, 250000, 500000 };

            long bits = 30;
            long bufferSize = (long)Math.Pow(2, bits);
            var mask = bufferSize - 1;

            int[] V = new int[bufferSize];
            for (int i = 0; i < bufferSize; ++i)
                V[i] = 1;

            long S = 0;
            Stopwatch sw0 = new Stopwatch();

            foreach (long step in stepSizes)
            {

                Stopwatch sw = new Stopwatch();
                sw.Start();
                for (long i = 0; i < numsteps; ++i)
                {
                    var idx = (i * step) & mask;
                    S += V[idx];

                }
                sw.Stop();
                Console.WriteLine($"{step}: {sw.Elapsed}");
            }

            Console.WriteLine("\n\nsum: " + S);
        }
    }
}
The C# test code
Experiments – Python
Python is a bit special in the sense that well written codes usually delegate “heavy lifting” to library functions. Those have hopefully already been optimized by their authors anyway. Often, we don’t even know their implementations or they are not even written in Python. Should we worry about data representation then? Well, we actually should.
In resource-intensive applications, the control is not in our hands most of the time. We neither handle heap allocations for binary trees nor do traversals of data structures via nested for loops, etc. We regain control between two long-running library calls and make some simple operations before giving it to another library function again. Obviously, this makes reasoning about the impact of data structure on execution times much harder, but it does not mean we cannot demonstrate the importance of proper data layout as in the C++ example. We just need to use a more “Pythonic” example. The effect gets visible only for bigger data structures in this simple test, however.
To keep things simple, let’s take a matrix, sum the elements only from the first column, and measure the run time.
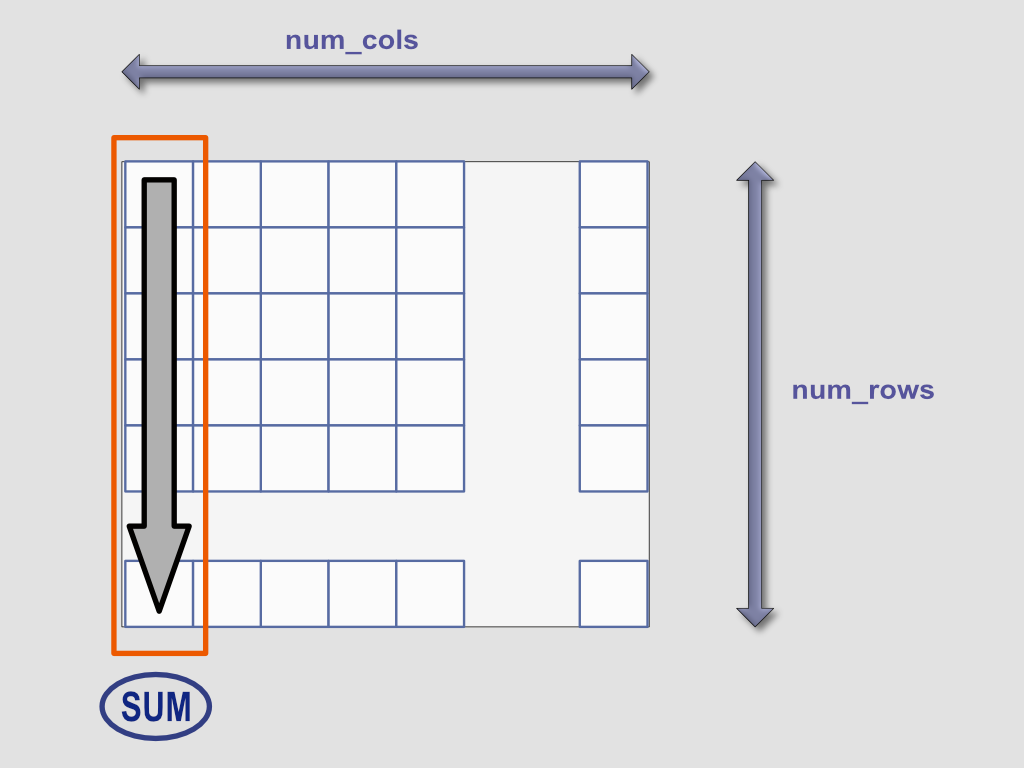
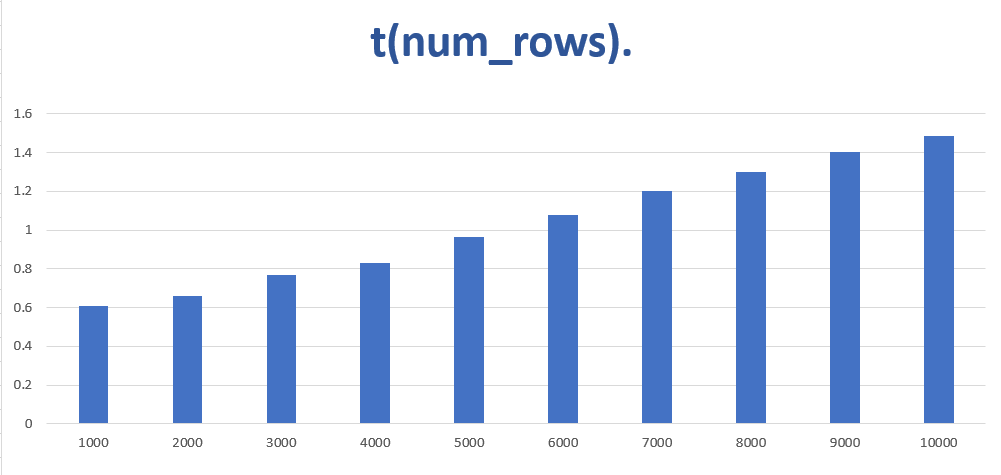
What happens when we start increasing the number of rows (and only the rows)? We expect the execution time to also become bigger as more elements are involved in the calculation. The call itself has some constant cost plus the traversal, so doubling the rows will not simply double the execution time; however, it will still increase monotonically.
Next experiment: What happens if we start increasing the number of columns (and only the columns)? You could say “nothing” as the number of involved elements remains unchanged; in turn, the execution time should not change. We expect the chart to remain flat.
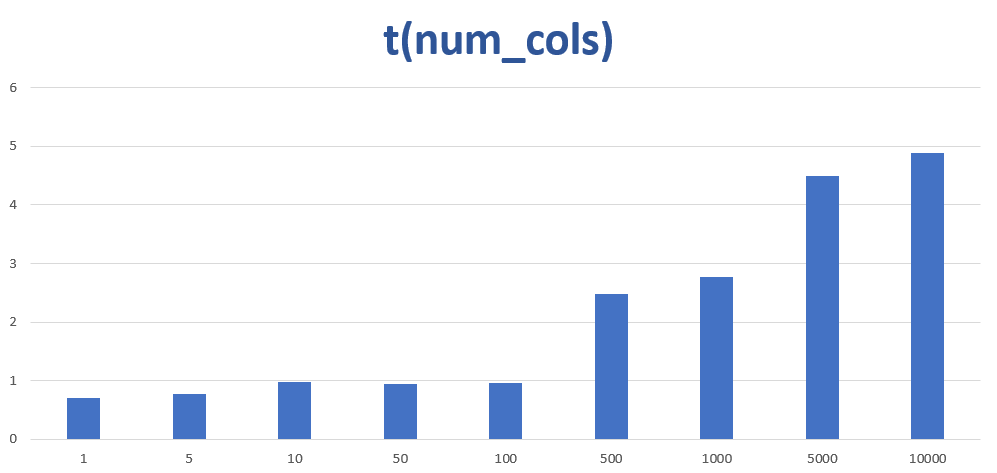
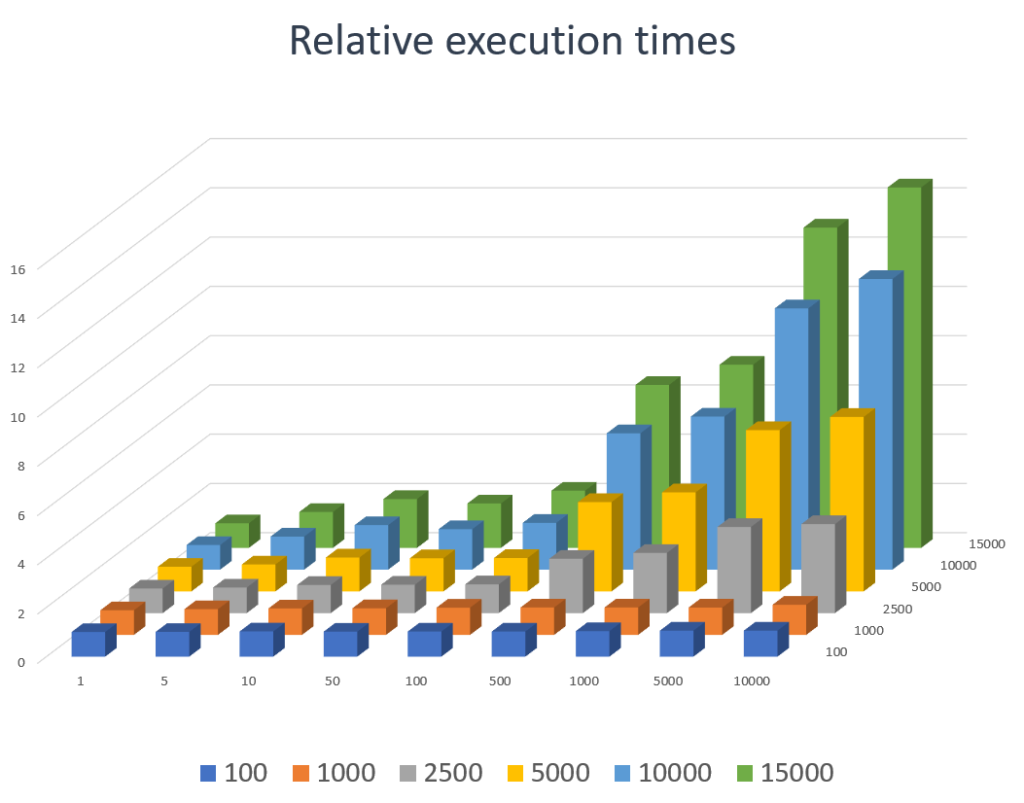
Something unexpected happened. The chart remains nearly flat, as expected, for a few dozen columns. Beyond that, the measurements start steeply increasing. When we reach 10,000 columns, the execution time is already seven times higher than a single column.
Because the impact is huge, i.e., we are not experiencing a few percent loss in efficiency but running seven times longer, we should find some explanation and, more importantly, a way to avoid losing most of the CPU time.
The relative time increase depends, however, on the number of rows. The explanation is probably related to the constant cost of calling the sum() function. When the matrix contains only 10 rows (i.e., 10 elements to add), the cost of traversing them is negligible compared with the cost of the function call sequence itself. When there are 10,000 rows, the cost of traversing them will dominate the overall execution time. This is clearly visible from the experiments where the run time increase factor is more emphasized for matrices with many rows.
Let’s repeat the above experiment for different height matrices. We keep the row numbers at a different constant while measuring with different column numbers. This gets us closer to the impression of what the worst-case scenario could be.
Note, however, that the results would not be directly comparable because different row numbers mean we run the sum for different numbers of elements. To this end, we show relative time increases as compared with the one-column case.
using System;
import time
import numpy as np
import pandas as pd

num_repeat = 100000
num_cols = [1, 5, 10, 50, 100, 500, 1000, 5000, 10000]
num_rows = [100, 1000, 2500, 5000, 10000, 15000]

results = dict()
for m in range(2):
    for rows in num_rows:
        execution_times = []
        for cols in num_cols:
            A = np.ones((rows, cols))
            V = A[:, 0]

            S = 0
            t0 = time.perf_counter()
            for i in range(num_repeat):
                S += np.sum(V)

            elapsed = time.perf_counter() - t0
            print(f"[{rows}, {cols}]: {elapsed}")
            execution_times.append((elapsed))

        results[rows] = [time/execution_times[0] for time in execution_times]
    df = pd.DataFrame(index= num_cols, data=results)
    df.to_csv(f"C:/tmp/res{m}.csv")
Test code measuring the above execution times. (Note, the experiment is run twice; only the second test results are kept to avoid the adverse effects of dynamic CPU frequency scaling. However, on most computers, you can get away with less warm up code.)
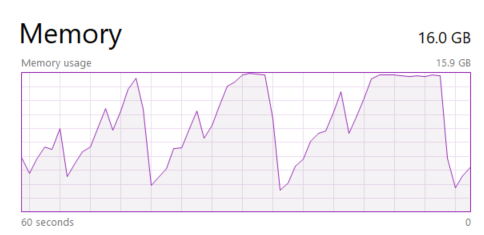
Looking at the charts, we see that increasing the row numbers makes the effect of increasing column numbers more pronounced. However, before going too far with the sizes, keep an eye on the memory. Raising the matrix sizes easily results in running out of physical memory. When this happens, the measured execution times start to skyrocket; however, those numbers are mostly unrelated to your data layout. The sample codes presented here were run on a machine with 16 GB of RAM. Running them on a notebook with less memory probably requires reducing the matrix.
A plausible explanation is the way matrices are stored. NumPy stores the matrices in a row major order (https://en.wikipedia.org/wiki/Row-_and_column-major_order). In turn, this means each “dummy” column we add also increases the distance between elements of the first column. Technically, we have reproduced the situation we tested in the C++ and C# examples: traversing the array represented by the first column requires bigger and bigger step sizes. The effect of those big steps has also been demonstrated with the C* examples.
If the assumption is correct, then we can easily counter it. Simulate transposing the matrix manually:
A = np.ones((rows, cols))
V = A[:, 0]
With:
A = np.ones((cols, rows))
V = A[0, :]
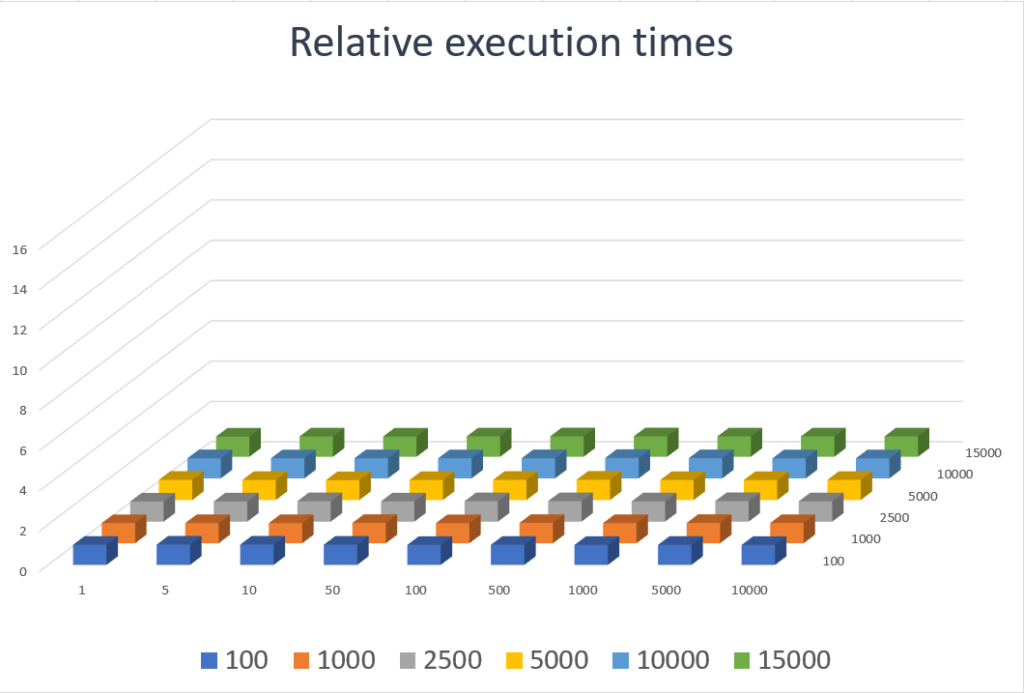
Now, we are iterating over neighboring locations in the memory. The measurements show that with this simple change, we have completely eliminated the 14 times increase shown in the previous figure. In some cases, it may be worth even creating the transposed version of existing data when it is intensively used.
When we are the creators of the matrix or can influence a library how to allocate it, it is enough to direct a Fortran type (i.e., column major) representation:
A = np.ones((rows, cols) , order="F")
V = A[:, 0]
No need to insert a separate figure with the results because the figure looks the same as the manually transposed one above.
Appendix – Measurement checklist
Properly measuring code run times is a tricky animal. These hints are related not only to our test routines but also apply to measurements in general. Many items could be appended; this is a subjective list with mistakes I have already overlooked at times in the past:
- Always set build target (where applicable) to “Release.” Debug builds are significantly slower and compiled to a different assembly code, often reducing or even completely hiding the effects you are trying to measure. (Setting up a quick test from scratch always defaults to Debug target.)
- Make sure to target the same architecture with all test projects. Although x86 is finally fading out, compilers still support it. You may bump into legacy project files set to x86 default. (Note, in Visual Studio and C# projects, the “Any” target with “prefer 32 bit” option left checked can also make you surprised.)
- Make sure to “warm up” the CPU before starting measurements, especially on mobile devices. The reason is throttling.
Modern devices apply dynamic CPU frequency that significantly slows down when not fully utilized. It takes some time to speed up after a demanding task starts. It corrupts comparisons if some test cases are measured at 2 GHz and subsequent ones are run gradually faster, say up to 3.5 GHz. I didn’t want to make these sample codes more verbose, but simply initializing the buffer byte-by-byte gets the job done on the CPU I used for these measurements.
(To be more precise, some CPUs are also able to scale upwards, temporarily boosting some cores’ frequency above their nominal speed as long as temperature conditions allow it. It is even harder to eliminate this effect because it’s unpredictable when thermal conditions kick in, depending on the current load, the cooler’s efficiency, etc.)
When I need to make sure the measurements are really precise, I like to repeat all test cases many times either on some round-robin manner or randomly shuffled while recording the execution times. If the times for each measured case look convergent, then they are accepted. If outliers start appearing or the results remain prohibitively scattered, then try finding out what’s going on before accepting those values.
In this post, we measured differences that are huge. I wanted to demonstrate only the “order of magnitude,” so a simpler approach is sufficient for brevity.
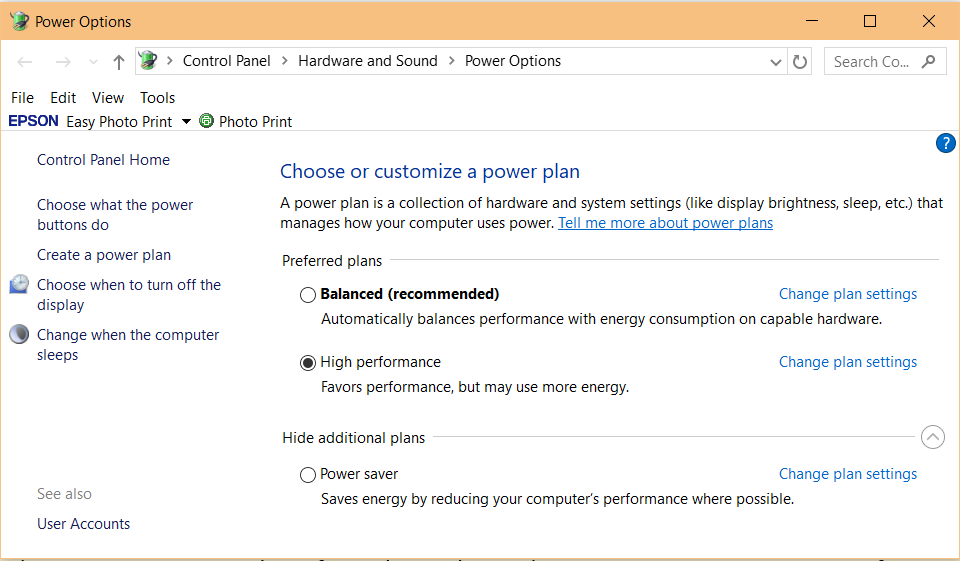
- Check energy settings. Some operating systems offer a choice if you wish to focus on energy saving or permanently keep high performance. The former setting makes throttling more aggressive and your measurements probably more scattered.
- Make sure there is no other task running in the background. (Idle CPU level is close to 0 in the TaskManager or ActivityMonitor.)
- Make sure you do not exceed available memory. (No memory exceptions are still the better outcome. I had some wasted hours about 20 years ago until realized that the OS started swapping out other applications in the background in response to my aggressive memory allocation, needless to say, this produces garbage results.) The memory sizes in my experiments are usually set to fit into 16 GB of RAM, but I need to
- Earlier, I had some bad experiences with platform-dependent high-precision timers (also the portability of such codes).
- Run the entire suite multiple times. Remember: “One measurement is no measurement!” Without going deep into statistics, means, standard deviations, and the like, seeing three run times of the same code immediately gives you an impression how scattered these numbers are. If there’s a significant difference, then you still have not eliminated all disturbing factors.
- If you are running the tests on a notebook, then make sure it is plugged in. The maximal CPU frequency and throttling strategy may be different when running from battery even if you tweak the settings.


